- Published on
DXY Creates Peak, What Drives Altcoin to Boom in Q1 2025?
- Authors

- Name
- Administrator
- @airdropdecks
The first quarter in the years following the Bitcoin halving event is often considered to be very good for altcoins, will this be repeated in this 2025 cycle?
In order for altcoins to grow strongly and be sustainable, the factor of cash flow into the market plays a rather important role, for example, as the cash gradually depreciates (devalues), investors will tend not to want to keep the cash that they will use to pour into investment channels, so the rising waves will be more sustainable.
Currently, the dollar strength index (DXY) is still on a strong upward momentum from October 2024, but it is possible that when the new President Trump takes office, history will repeat itself. In 2017, when he took office, he said the dollar was “too strong,” making it difficult for the United States to compete with Chinese companies. Then the dollar fell in value, followed the sharp rise of the Crypto market from January 2017 to December 2017.

This can be repeated one more timewhen the USD is rising continuously but on the technical chart, the price is showing a divergence signal from the top of the RSI MACD that could cause the DXY to depreciate in the near future, also during which the new President will inject liquidity to stimulate the economy, from which the dollar will gradually decrease in value.
On the technical chart DXY is still presentpotential peak divergence signal, as the DXY falls below mark 106.34At the D1 candle, this signal is confirmed and this is a very good signal for risky investment channels such as BTC and altcoins.

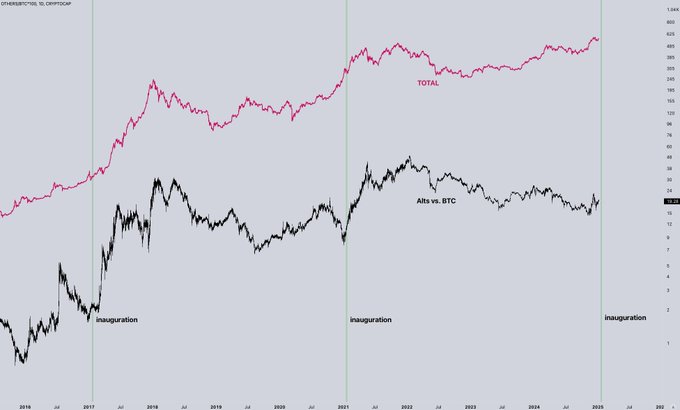
In the 2016-2017 cycle there was a similar signal, when President Donald Trump took office at that time the DXY also had a potential RSI MACD peak divergence signal at D1. This signal was then confirmed and the DXY fell sharply, dragging the total Crypto market capitalization (in red) up sharply from January 2017 at $10 billion to $500 billion in December 2017.
It was also the period that helped a lot of altcoins x5x10 times their price in 2017, the boom period of the crypto market.

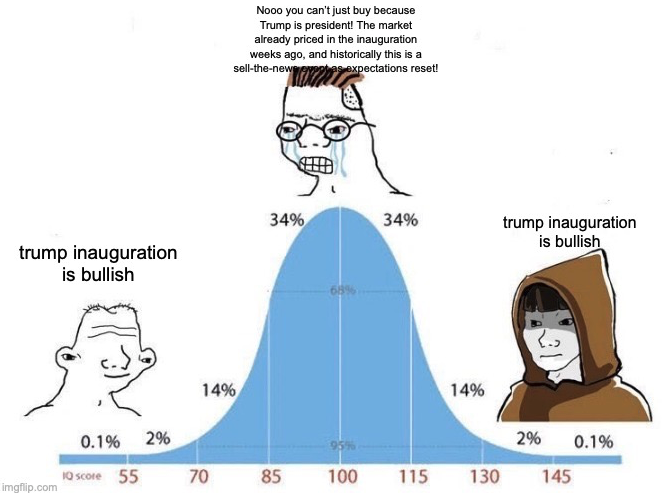
At the stages of the inauguration of the US President, the crypto market often turns positive immediately afterwards in terms of both the total market capitalization chart and the altcoin price. This can happen again in this cycle..
Positive signals also appear on the on-chain data, which could help BTC continue to rise in the coming months.
Hidden bullish divergence signalsappears on the NUPL, MVRV data. Onchain makes a lower bottom, but BTC price (white line) still makes a lower bottom, which indicates that even though the selling force is strong, it is not possible to cause the price of BTC to fall more sharply than the previous bottom.

This signal appeared in the period of September 2024 and then pushed the price of BTC up from $60,000 to $108,000.

In the short term on the H4 frame, positive signs have gradually appeared when the total market capitalization chart (TOTAL)confirmed bullish trend structure, so it is possible that in the short term there will be a slight wave of correction before the market resumes this bullish momentum in the coming weeks.

Adding to this the Bitcoin H4 market share chart has confirmed to the downtrend, which is very good news for altcoins in the coming period. Considering the cyclicity, BTC market share has peaked and will gradually decline, on the H4 frame confirming the downtrend, so altcoins will gradually benefit to rise sharply.

The H4 frame BTC price chart is still in an uptrend, supported by bullish divergence signals, so there is a possibility of continuation of the uptrend, however if BTC market share enters a downtrend, so the upcoming bullish momentum, altcoins will rise more strongly than BTC.

With so many positive signals appearing gradually on the charts, the first quarter of this year is likely to repeat the history of Donald Trump's inauguration and the dollar's strength diminishes, thereby spurring strong growth for the risk asset class.

