- Published on
Is ETH undervalued compared to Bitcoin?
- Authors

- Name
- Administrator
- @airdropdecks
While Bitcoin is only 12% away from ATH and has risen continuously from 2022 to now, ETH is 84% behind ATH and has yet to show a strong bullish performance in 2024. Will ETH revive in 2025?
On the Month (M1) chart of the ETH/BTC pair, it can be seen that ETH has been weaker than BTC since the period of 1/2023 until now when the price has been continuously falling. This is also the result of the Fed's monetary policy tightening. This causes the flow of cash out of the high risk asset class in cryptocurrencies such as altcoins.

However, the current moment isfor the first time in historyETH/BTC pair has a broken signal oversoldon the RSI indicator when the RSI has fallen below the 30 mark (oversold).
These could be early signals that ETH will begin to outperform and outperform BTC in the coming months, as the market begins to be optimistic again.

In the weekly frame (W1), ETH/BTC has fallen back to the support zone in the period of 12/2020, which is also the time when the altcoin season 2021 begins to take place.
At the moment, the trend structure of the W1 frame is inclined to the downside, if this 0.025 support zone is held together with the Fed action that decides to end monetary tightening in the upcoming 19/03 or 07/05, the ETH/BTC pair will begin to rise sharply.

The ETH/USD pair frame W1 shows the main trend is bullish, the price is above EMA300 weekly (blue). The price has just hit the bullish trendline and bounced back indicating that by the time of writing, the price has successfully retest the trendline.

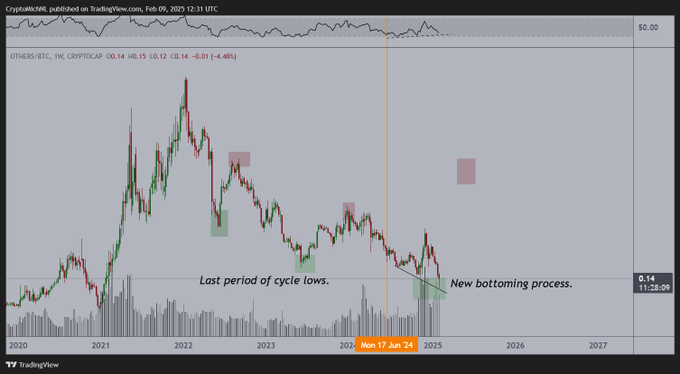
The @CryptoMichNL account, which has more than 700,000 followers on X, said that on the OTHERS/BTC pair — the altcoin capitalization outside the top 10 compared to Bitcoin — there was a bullish divergence in the W1 frame, but this signal has not been confirmed on the price action of smaller timeframes.
The BTC market share chart last week had a sharp rise to 64.34% but fell back, marking the highest level of BTC market share in the 2024 - 2025 cycle.
Historically, the sharp increase in activity on February 3, 2025 was quite similar to that of December 28, 2020. Specifically, BTC market share spiked to 73.63% (highest in the 2019-2020 cycle) followed by a sharp drop in BTC market share.
Regarding the W1 frame trend, BTC market share is in an upward trend from 2022 to now, which suggests that concentrated cash flow in BTC is the main one, as BTC market share increases, altcoins will be at a disadvantage in the short term.
However, if the cyclicality of the market is repeated, 2025 will still be a period of sharp rise for BTC and altcoins. Especially altcoins because the BTC market share already has the RSI peak divergence signal, as long as the BTC market share falls below 59% would confirm for this signal to be activated.

On the futures market there are quite positive data. The average funding rate on major exchanges such as Binance, Bybit and OKX fell to 0%.
In terms of 2023, every time the Funding rate drops to 0%, then the price of BTC will enter a strong upward wave, as investors have shifted from optimistic to pessimistic sentiment.

In 2025, the United States has $9,200 billion in debt that needs to mature or needs to be refinanced at higher interest rates.
The way the United States has been using since 2010 is to print money and devalue the dollar. This causes the dollar to fall in value, money flows and strong flows into risk investment channels, causing the price of risky assets to rise.

This could be repeated in 2025 giving the crypto market a strong boost this year.
So, if Fed Ends Monetary TighteningIn 2025 and the US government refinancing further to repay debt, this will be positive macro information that will help altcoins to grow strongly. Especially ETH, when it is one of the largest altcoins in the market, is oversold on the M1 frame versus BTC.